Making Data Meaningful and Understandable for the Audiences.
AIBD/ EBU/ RTB Online Masterclass on Data Visualisation
25 – 28th January 2021
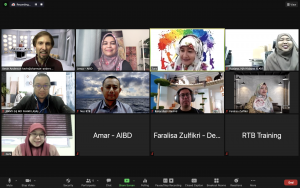
This 4-day activity was organised by Asia-Pacific Institute for Broadcasting Development (AIBD), supported by European Broadcasting Union (EBU) at the request of Radio Television Brunei (RTB). The participants were DJs, producers, motion graphic artists and staff working on a new digital video effort at RTB in Brunei to develop the skills to find data, find the stories in that data and then tell stories that would engage audiences on-air, online and on social.
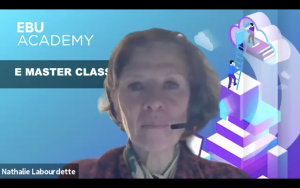
The Online Masterclass was inaugurated by Ms Philomena Gnanapragasam, Director of AIBD and Ms Nathalie Labourdette, Head of EBU Academy.
The sessions looked at some of the most impressive examples of data journalism. Many have been done by newspapers, which have developed sophisticated data skills and teams in particular news organisations that did complex simulation of how social distancing could ‘flatten the curve’ and reduce the spread of the coronavirus.
One of the most important parts of any training is how relevant it is to the work of participants and the audiences that they serve. After discussing their daily work, the consultant Mr Kevin Anderson, Managing Producer, Ideastream and Faculty member, EBU Academy, found that much of participants’ digital output was focused on engaging audiences on social media. Just as data journalism has proven incredibly popular with audiences on the web, digital editors have found that simple charts or graphs engage social media audiences four to six times more than a photo or link.
With this in mind, the webinar focused on ways that data journalism and infographics could engage the social media audiences at RTB, particularly surveys using Google Forms to engage audiences, data mapping and Infogram to create attractive and engaging infographics that could be shared on social media.
Data journalism doesn’t have to be the massive projects done by newspapers. The E–Masterclass participants learnt that broadcast journalists can create simple graphs, maps and clever videos that help their audiences understand our complex world, and RTB producers.